Designed and developed a KPI-driven executive dashboard to monitor revenue, profitability, return rates, and product performance across a retail dataset.
Business Objective
Enable senior stakeholders to monitor commercial performance, identify revenue drivers, and assess the impact of returns on overall profitability through a consolidated reporting view.
Analysis highlights revenue concentration, return-rate impact on margin, and product-level contribution to profitability.
Key Features
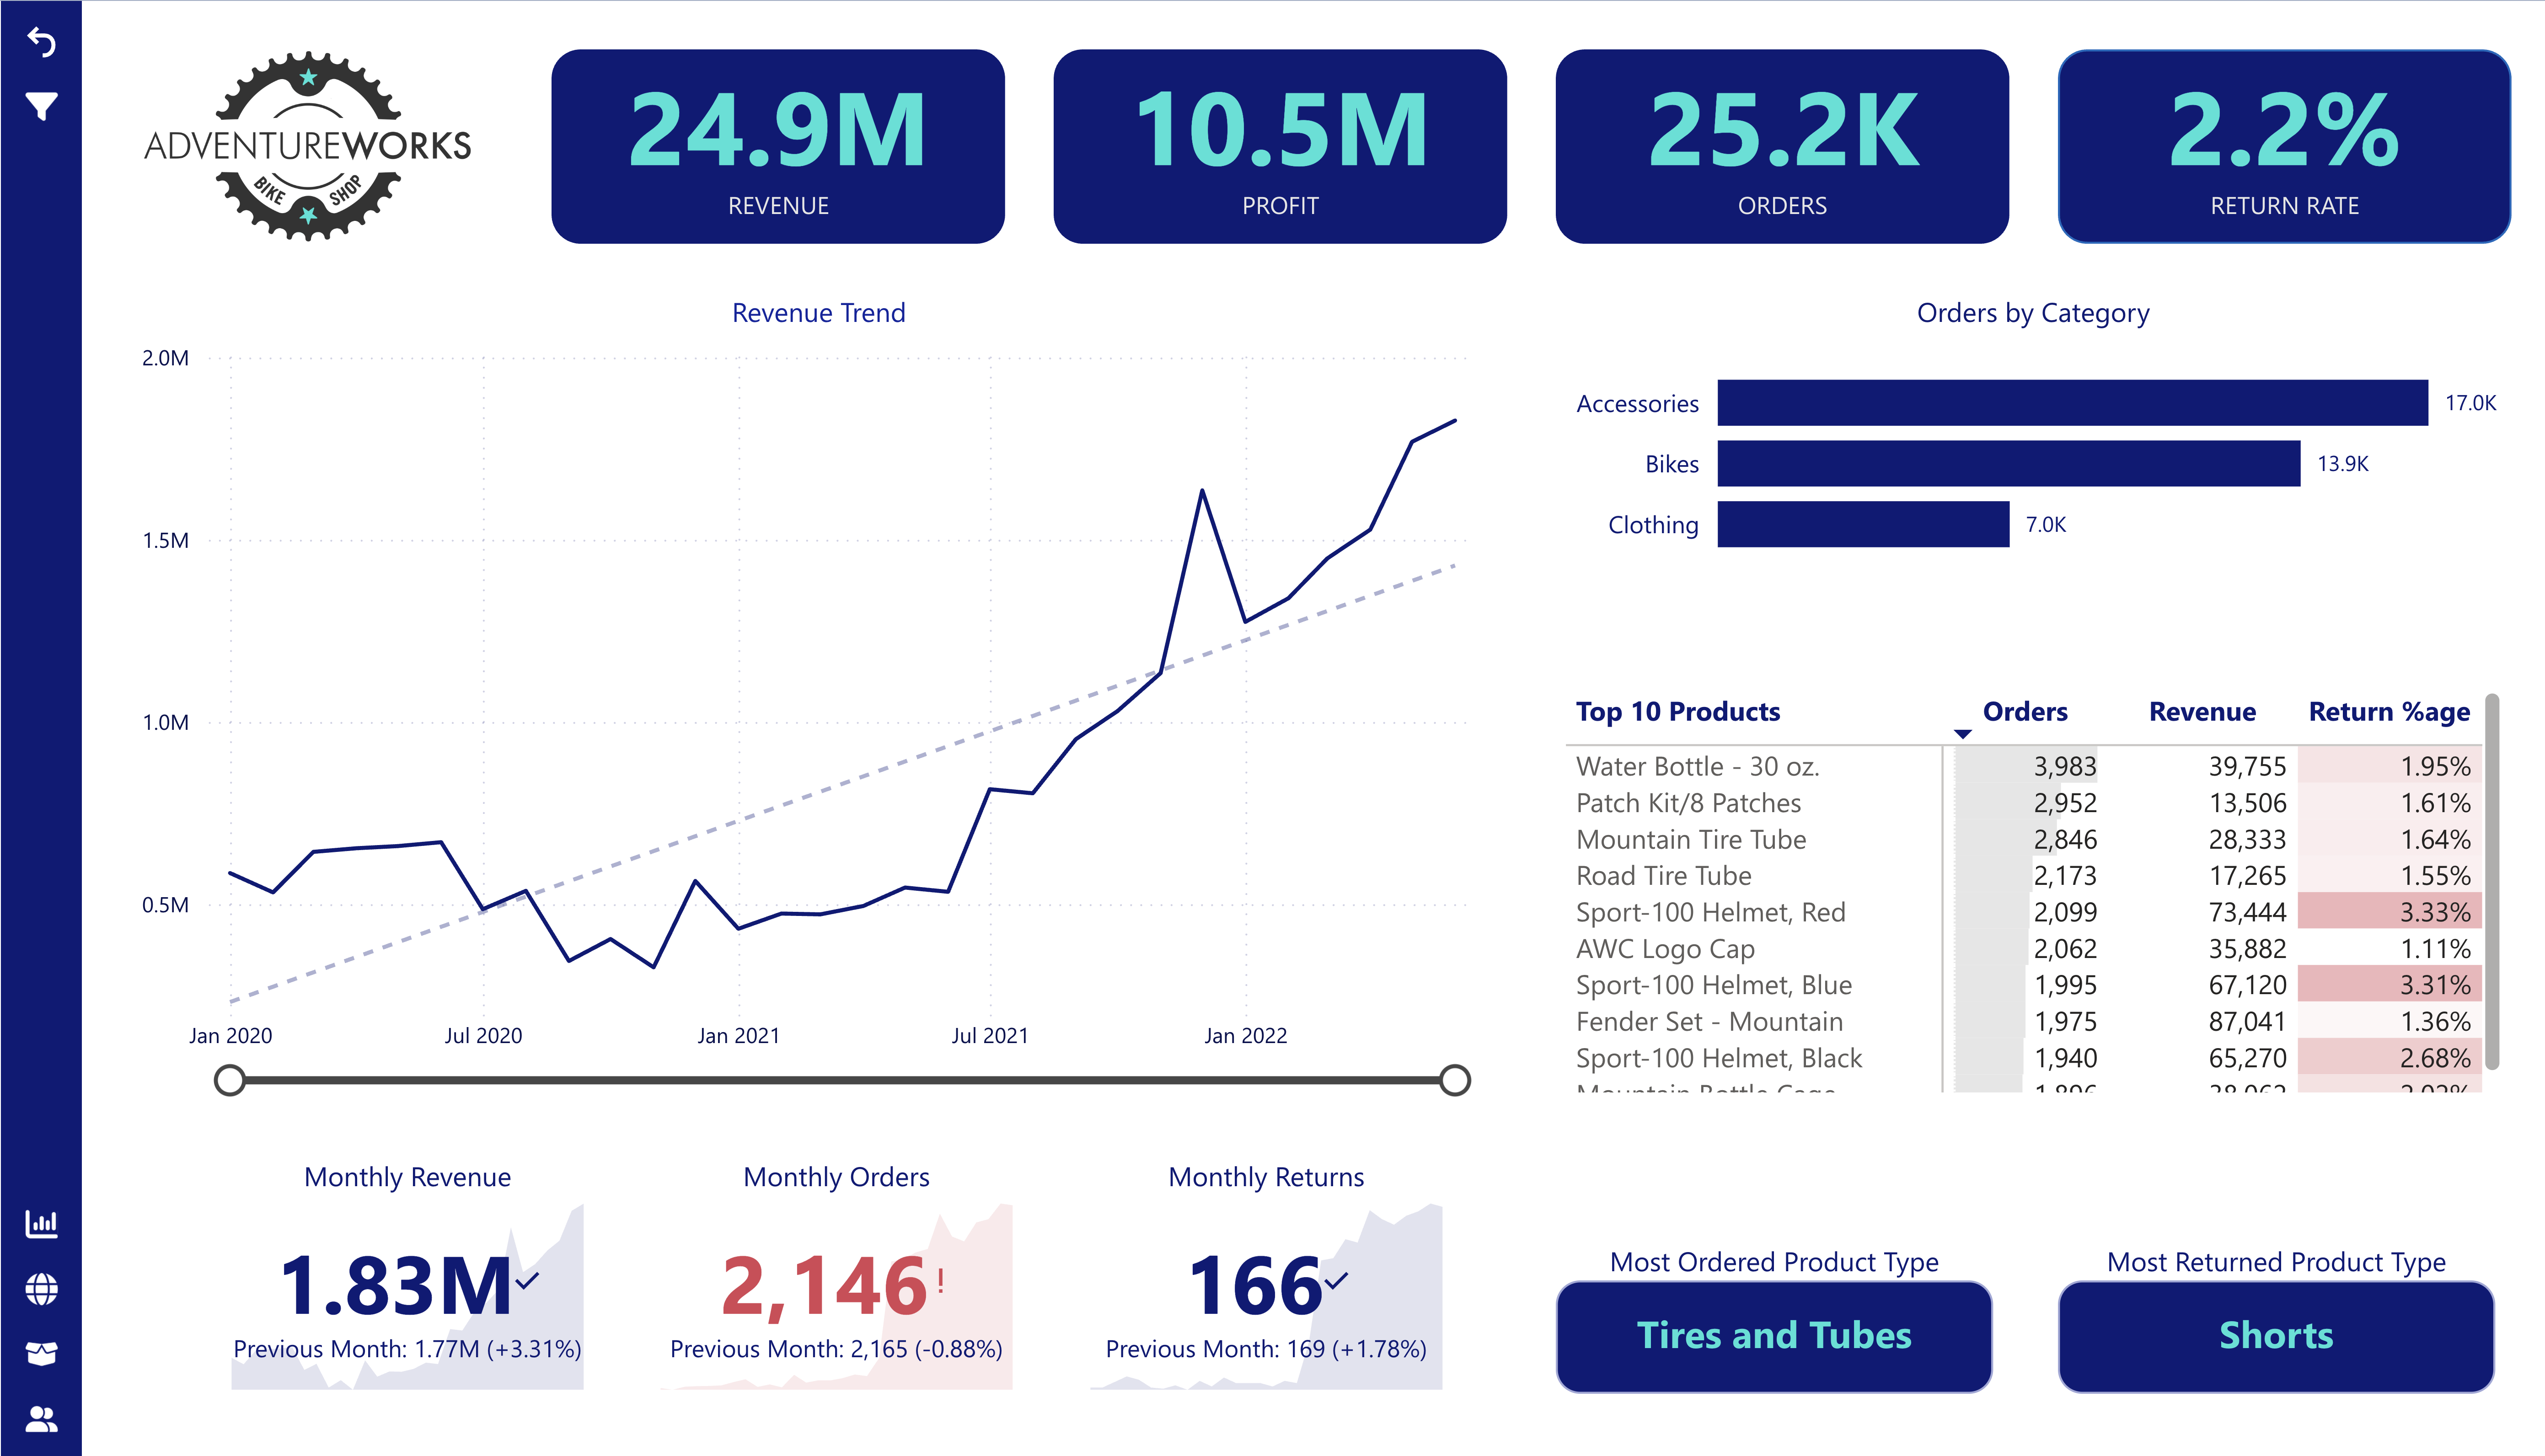
- Total Revenue, Profit, Order Count, and Return Rate KPIs
- Monthly revenue, orders, and returns trend analysis
- Revenue performance by product category
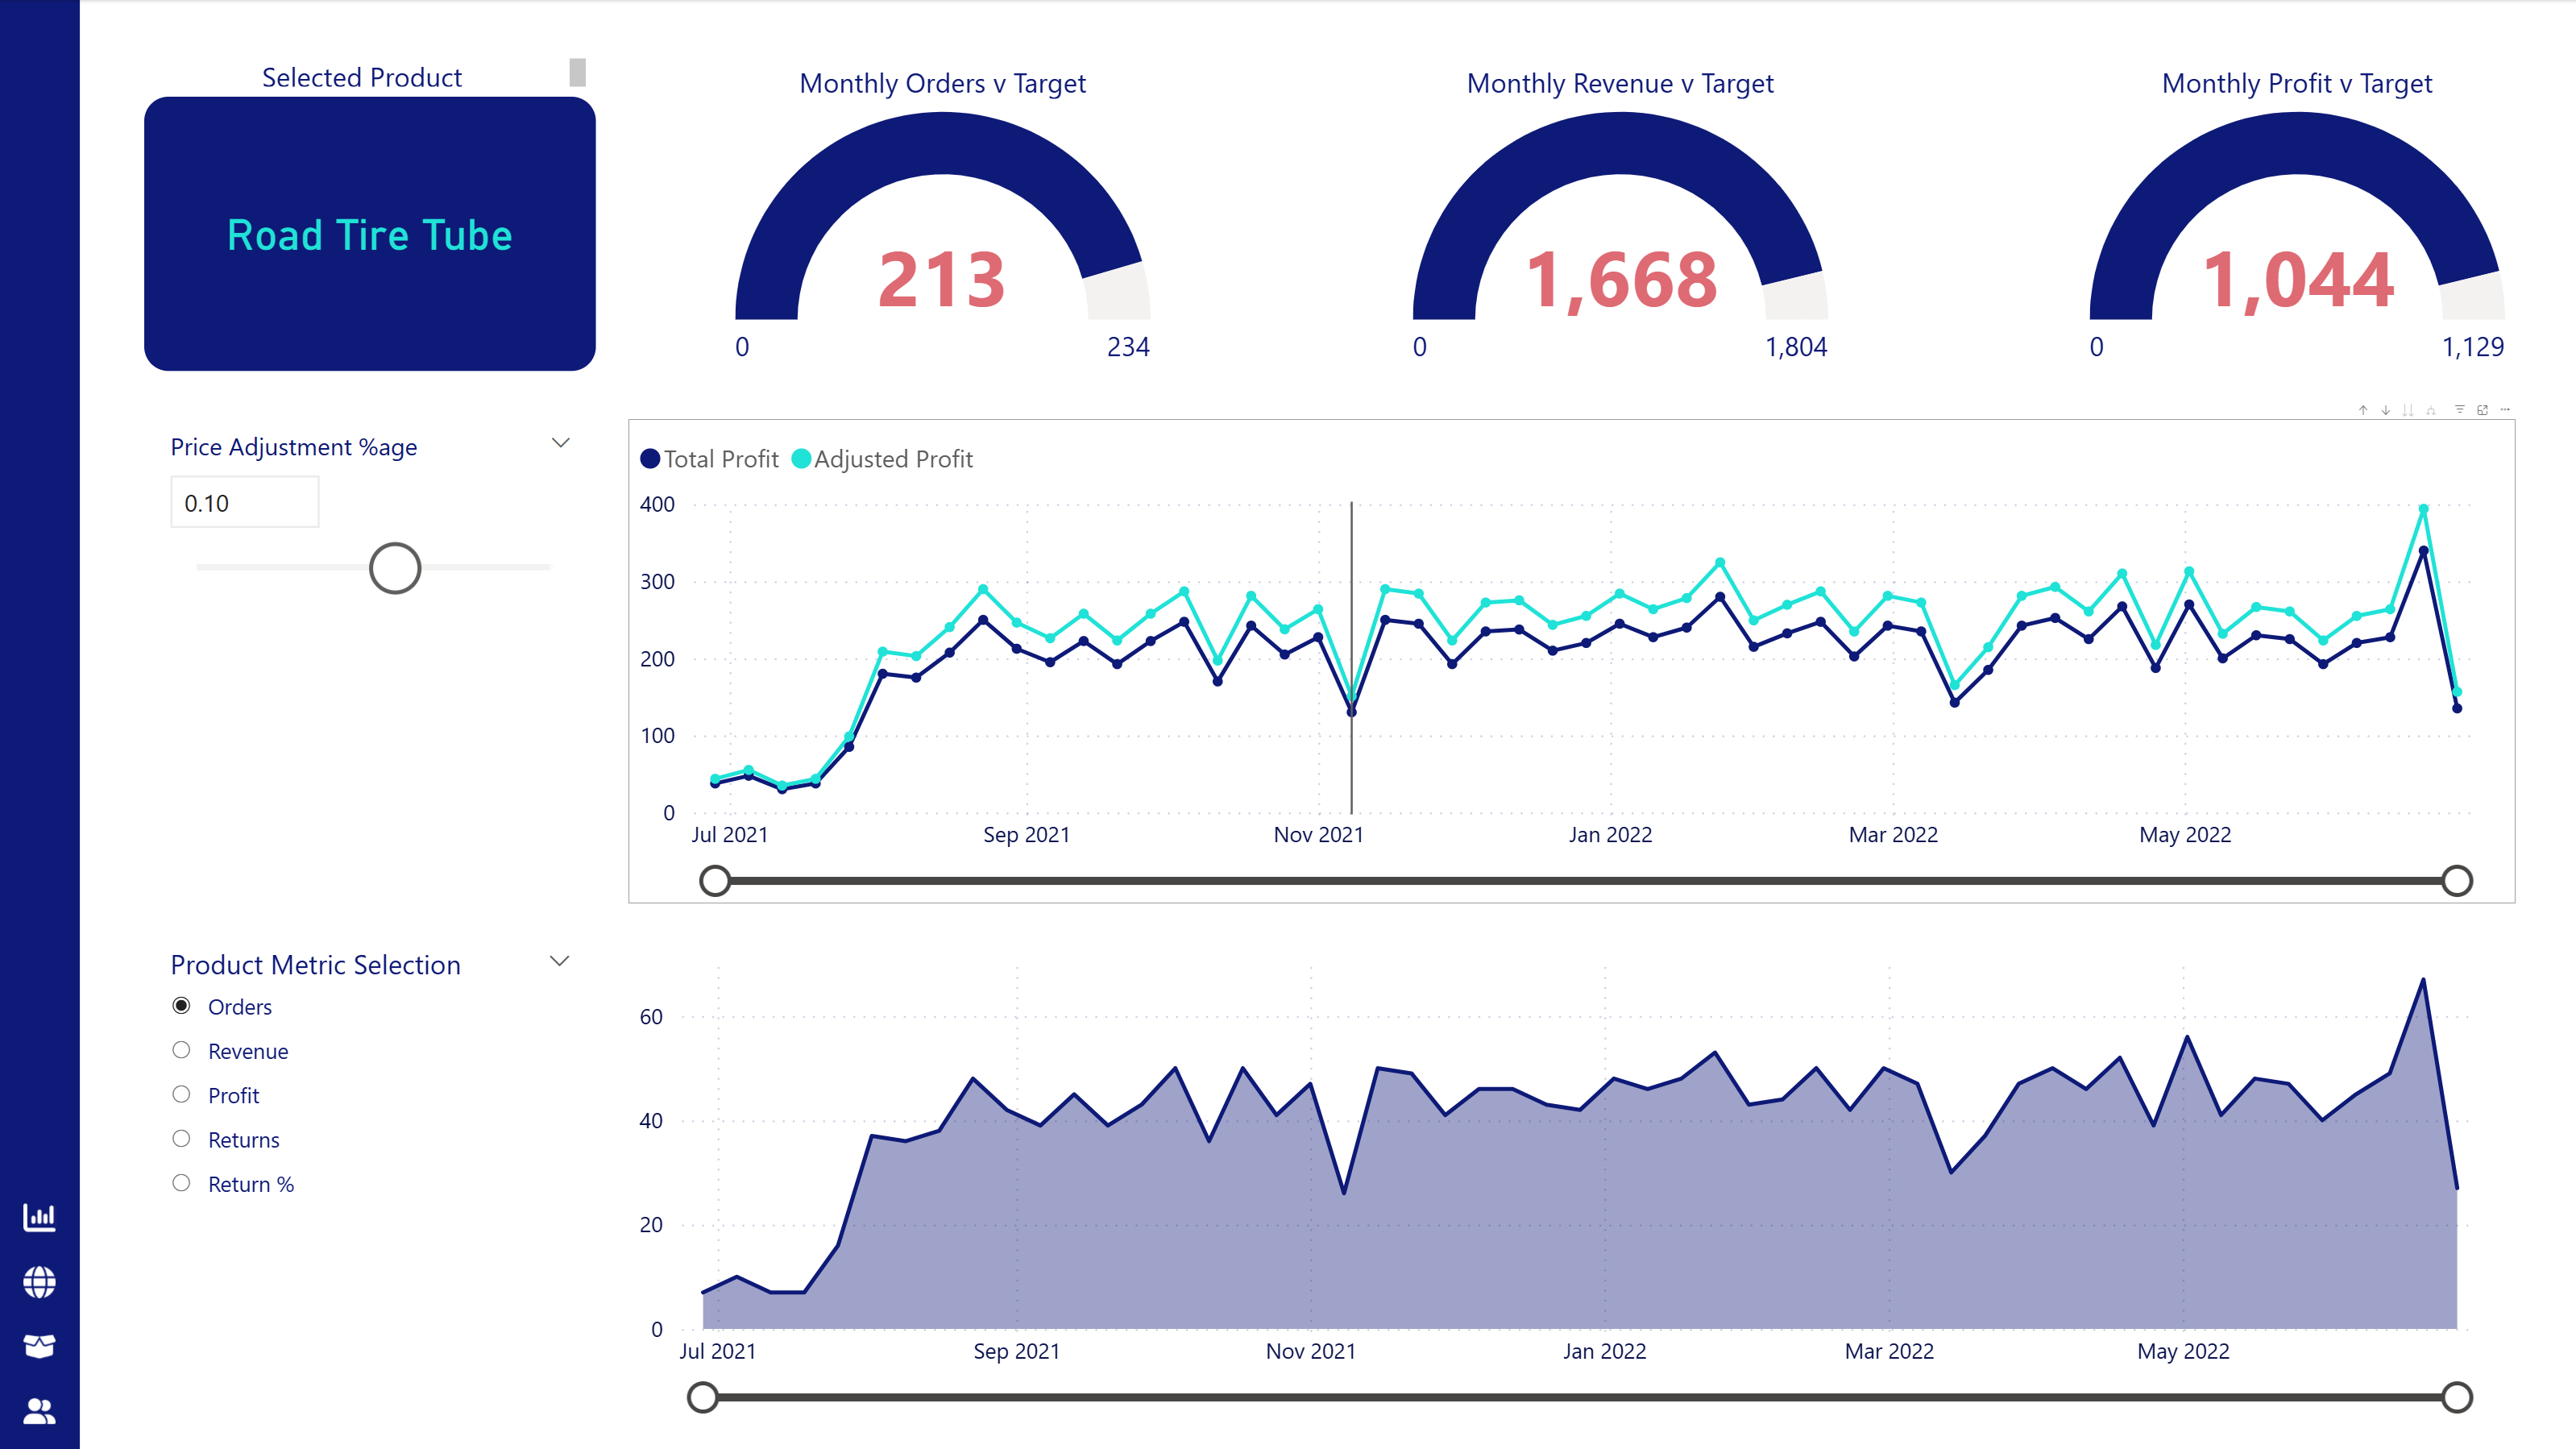
- Top 10 products by revenue contribution
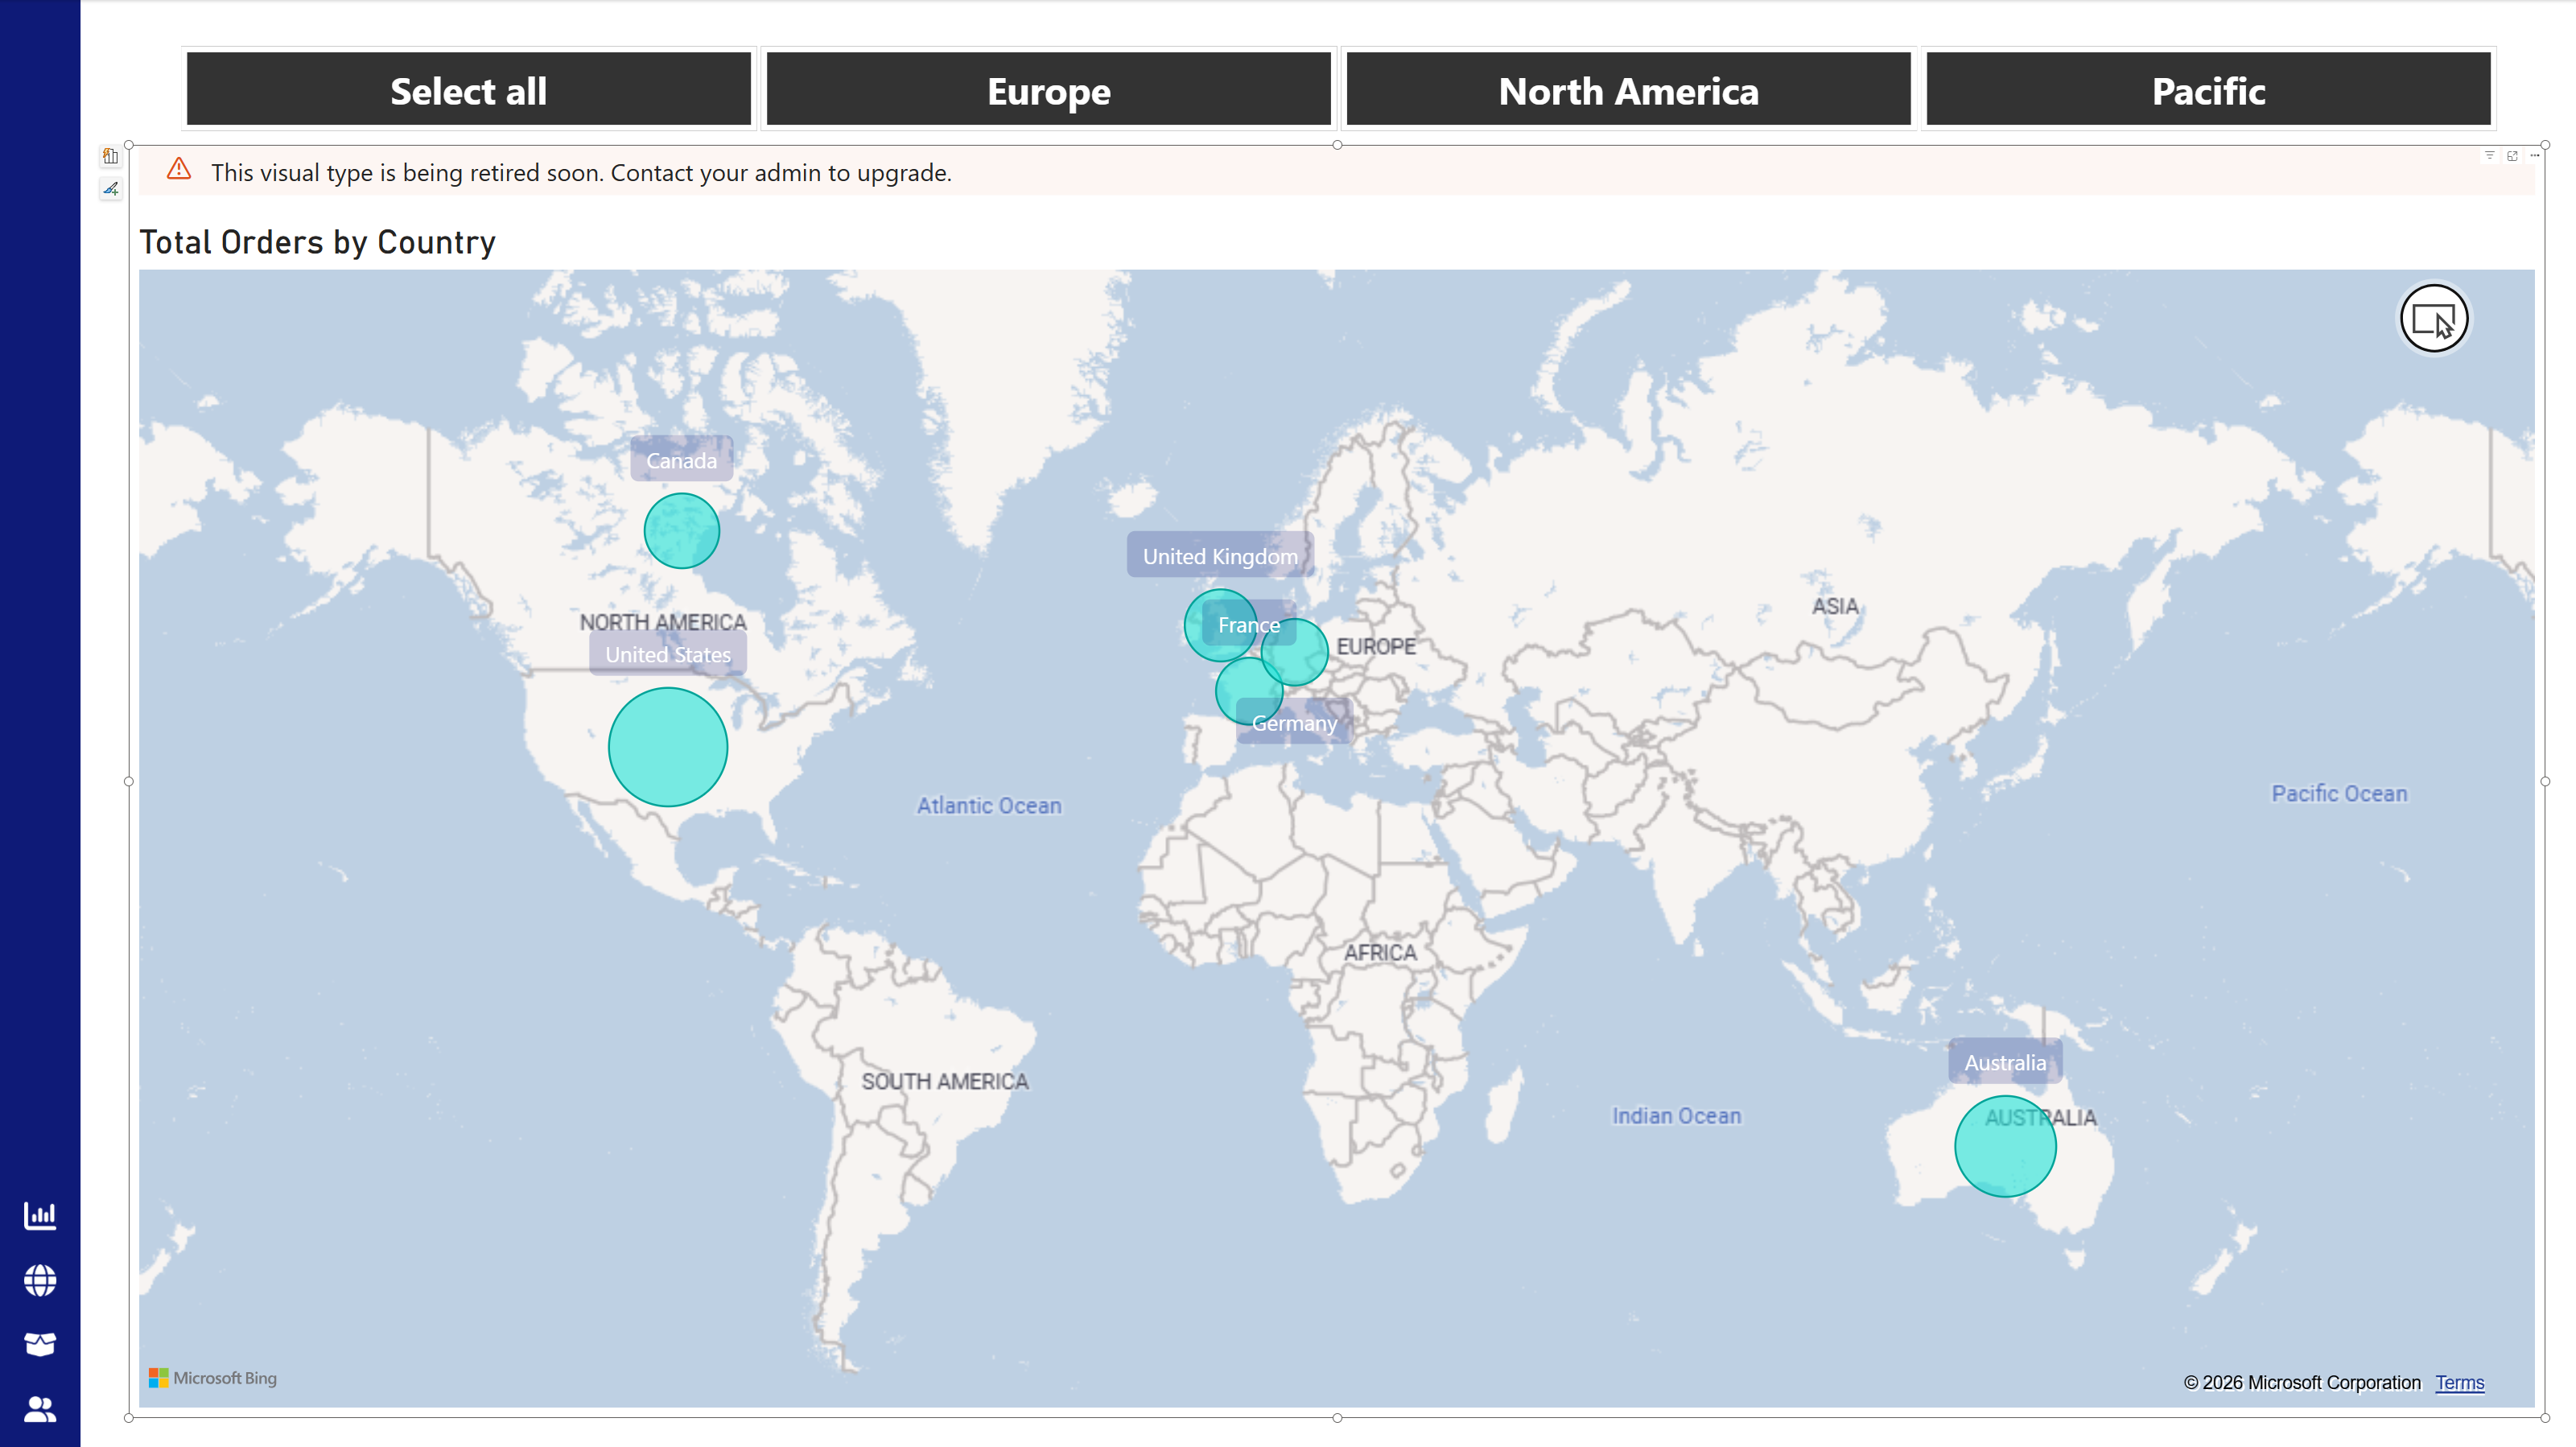
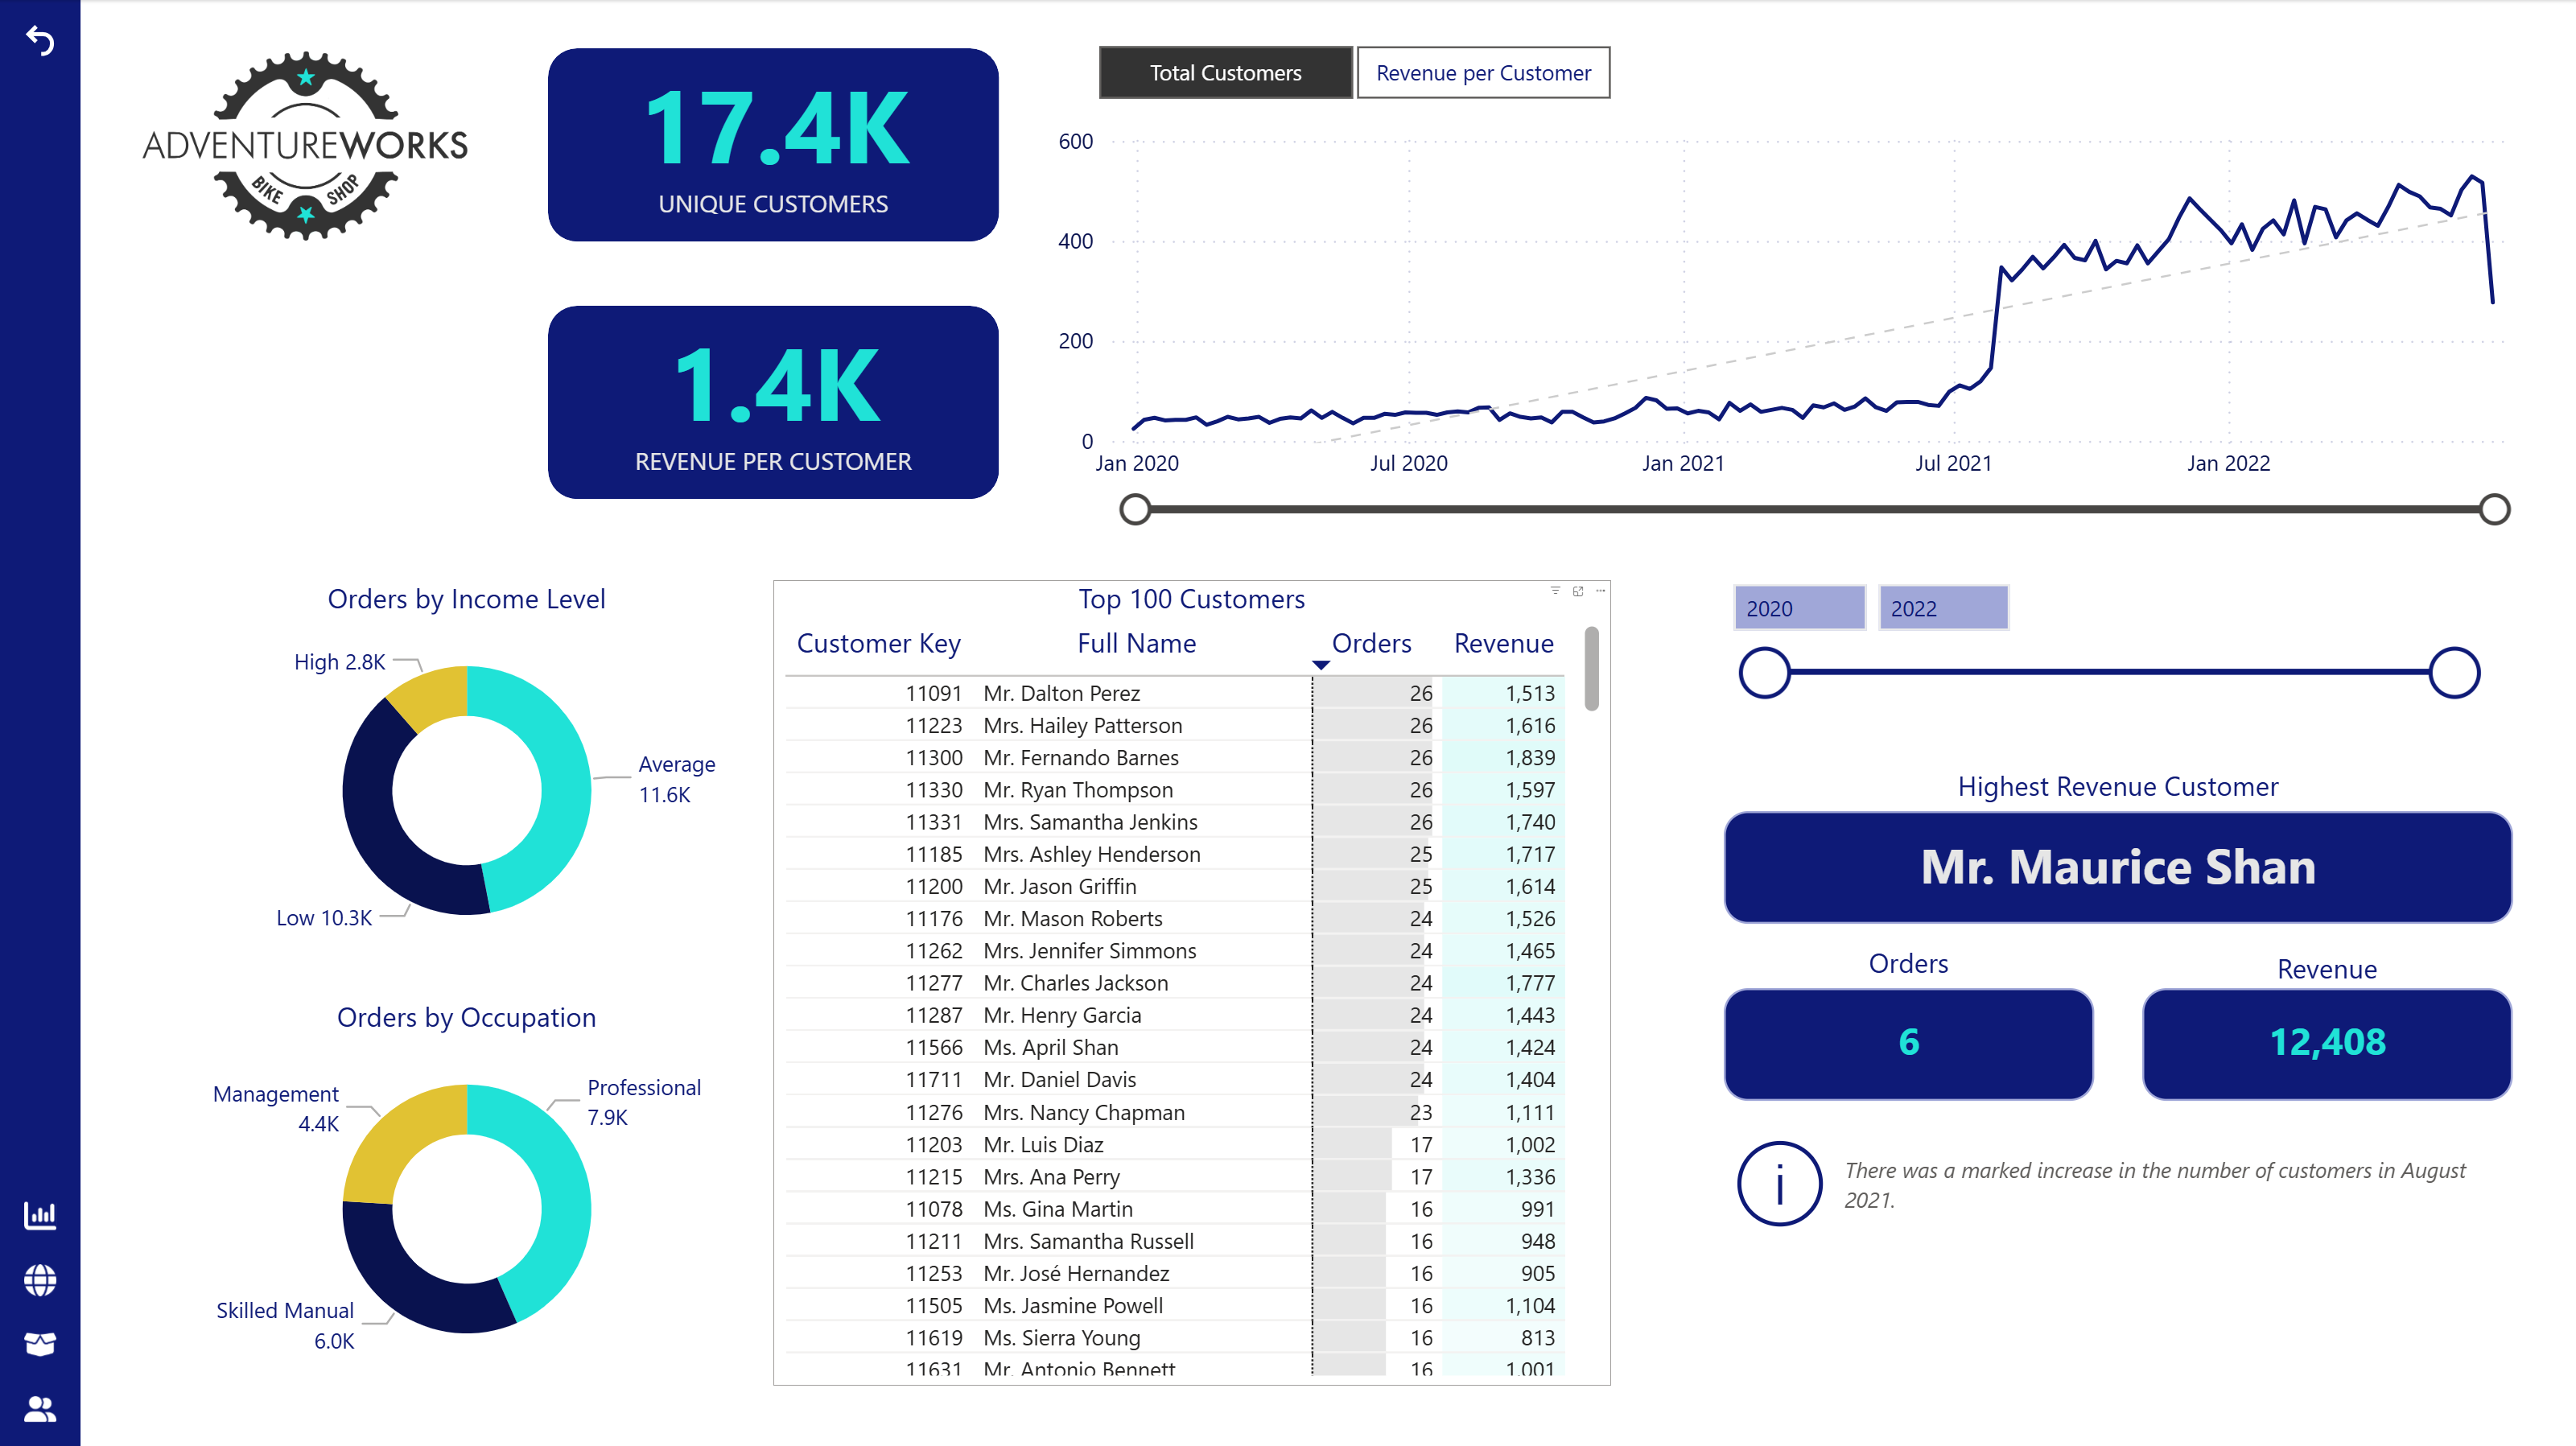
- Customer and regional performance breakdown
Tools & Techniques
Power BI | DAX | Data Modelling | KPI Development